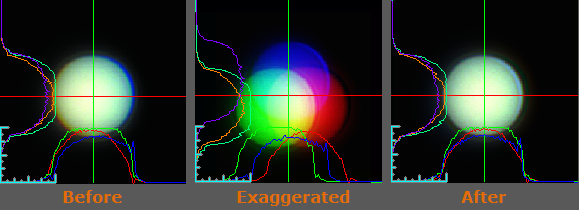
The Intensity Profile Layer displays an intensity profile per image channel, along the bottom and left edges of an image. As with the annotation, region of interest and scale-bar layers, this intensity profile layer is only a visual overlay. As such, the only way to save, print, or copy it is to use the associated "Display Image + All Layers" command while the layer is made visible.

The example above shows the intensity profile layer of an image before and after image registration. The middle image is used to show an exaggerated view of the intensity profile.
When the Activate Intensity Profile Layer is enabled, use the mouse cursor to drag the red and green cross-hairs (which initially appear near the top-left corner of the image) to a location in the image where the intensity profiles should be plotted. The X and Y coordinates of the intensity profile are reported in the Cross Profile Position dialog. The position of the intensity profile may entered or adjusted through Cross Profile Position as well.
Note: The Intensity Profile layer is useful during the alignment of color registers. The example above provides a before, after and exaggerated illustration of the register process.
The intensity profile for the lines are plotted along the bottom and left sides of the image. It is continually updated, when live or during playback. The Intensity Profile Layer icon is located in the Annotation toolbar, click the Intensity Profile Layer drop-menu for a list of options.